

A customised approach to an enhanced e-commerce module
- Bluerank & enel-med
The enhanced e-commerce module is designed to track transactions from online shops. In a customised approach, we used the data from enhanced e-commerce to track the path associated with making an appointment with one of the largest healthcare providers in Poland.
Challenges
Standard target measurement becomes ineffective when registering tens of thousands of doctors - we wanted to know more. Which doctors are selected and viewed most often? How does the busy schedule affect the number of bookings? Which cities have the most views of the schedules but few bookings? These are some of the questions and issues we wanted to know the answers to. An additional challenge was the fact that open schedules in enel-med is not a typical sales platform. Our aim was to adapt the events and functions of the e-commerce module to the user's interactions on the site. The whole process was phased and the implementation itself took 3 months.ommerce module to the user's interactions on the site. The whole process was phased and the implementation itself took 3 months.

Strategy
A custom project requires a custom approach and getting the process right. Most of the time it took us to deliver the tool and answer questions was spent in discussions and getting to know the customer's business. The implementation of the GA4 was the last - and the easiest - stage.
The specific stages of our work were as follows:
- initial interview and gathering of initial requirements and expectations,
- internal status and preliminary design of the solution,
- meeting with the developers to determine the technical possibilities,
- design of the final implementation and preparation of requirements for the developers,
- discussing requirements with developers and developing a method of collaboration,
- implementation of tags via Google Tag Manager,
- verification of the quality of the collected data, and providing comments for improvement.
Implementation
- Defining KPIs and expectations
The first stage was to meet and help define the key functions, metrics and business needs.
A team of specialists from both enel-med and Bluerank were involved in this process. In addition to the person responsible for delivering the product, people from the e-commerce, marketing, analytics teams, and the developers who had to prepare the relevant scripts were involved.
This step helped us to gather all the requirements and ‘map’ them to the capabilities of the e-commerce module in GA4.
- Solution planning and design
We then held discussions with the IT team responsible for building the service. We prepared very detailed requirements to address the business needs we had identified. At this point we were able to move on to designing the implementation, the data layer and preparing detailed requirements for the developers. After these stages, it was all in the hands (or rather fingers  ) of the developers.
‘It was very important that the development team not only uploaded the codes, but that they were aware of the needs and understood the importance of their work,’ says Patryk Kinel, responsible for the implementation on the Bluerank side.
This was not an easy process as we used the advanced e-commerce functionality to track behaviour in active doctor schedules - a tool that finds its use in typical shops. By properly mapping the EE elements, we were able to generate reports that we could read with ease.
The doctor is identified by a unique ID stored in the database. We stored the city in the brand parameter. In the product name, we sent a specific type of visit, e.g. an appointment with an internist.
-
Further iterations and improvements
First meetings usually do not solve all problems, so we held regular meetings where we went through each piece of code before proceeding with the implementations. When we encountered a technical problem, we worked out an alternative solution together.
-
Implementation
With a prepared environment, we were able to implement the relevant tag rules and Google Analytics 4 based on the designed solution.
The entire implementation was carried out using Google Tag Manager, which is an indispensable tool in this regard. After implementation, we verified the correctness of the data collected in Google Analytics 4.
This approach allowed us to make agile improvements to the implementation and catch bugs that would not have been detected during normal testing.
Results
Thanks to the planning of the people involved and the experience of the teams, the advanced implementation went quickly and smoothly. The result is a statistical tool tailored to the client's needs.
The enel-med team can monitor the effectiveness of their campaigns; they can easily see which doctor, facility or city is most popular with their patients. They are able to check the performance of the path to purchase through the relevant reports.
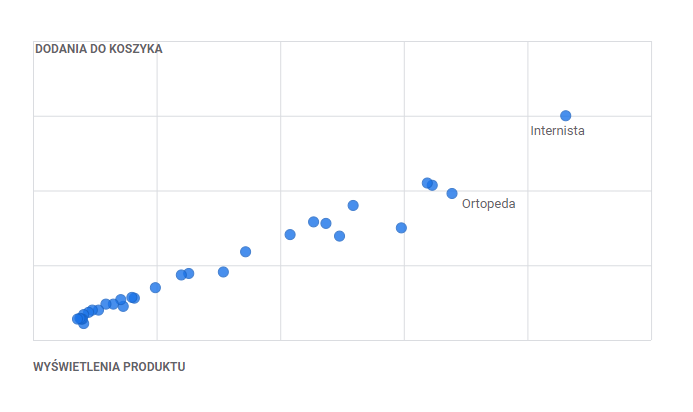
In order to better understand the needs of the people who use our service, it is useful to know which specialists they are looking for and which of them are most in demand.
The accompanying scatter plot shows clearly and transparently which services are most in demand and for which the registration processes have been initiated. This form of data visualisation allows us to find products that deviate from the average when their position is significantly different from the line drawn by all products.
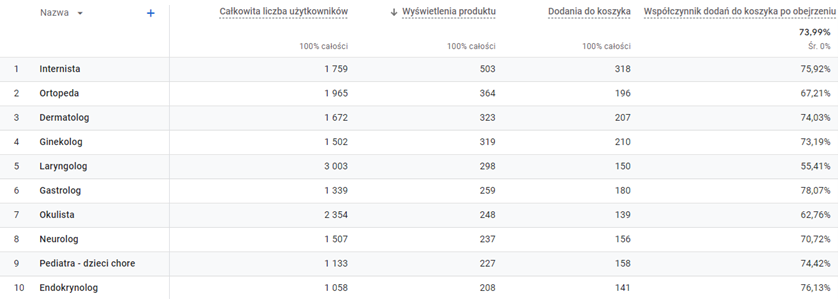
Here, the same data is supplemented by a metric showing the total number of users who have searched for the services in question and the conversion rate of adding to the cart after viewing. We can easily see if the traffic we are driving to our service is relevant and find what they are looking for.
Very often, once a solution has been designed, it is not reflected in reality, and what is obvious to us is not so simple and good for others.
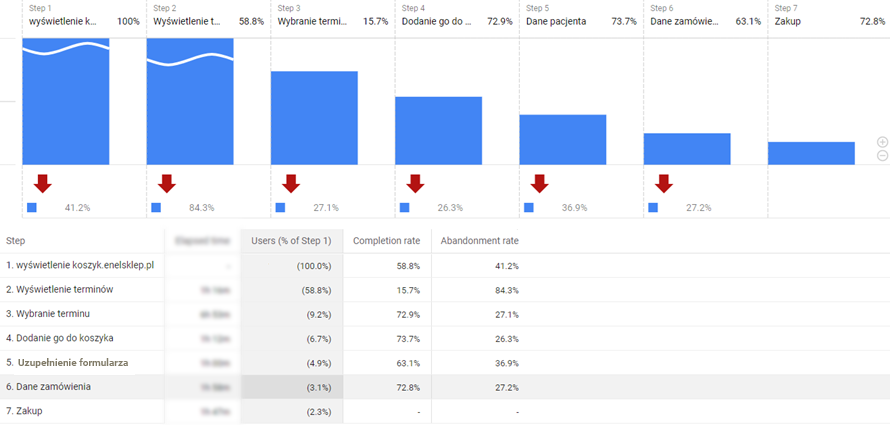
One example is the path to registration (checkout). It is important to understand how long it takes people to get from their first visit to the purchase. How much time do people take at each step? Where do most people drop off? Is there something wrong with the offer/service or perhaps the functionality of the site?
We can answer most of these questions using the accompanying report. Users take the longest to choose a suitable date, with 72.9% of those who decide to go ahead doing so. This may mean that those planning a meeting want to adjust their calendar as much as possible and choose the best date (industry specific).
Most people drop out at step 2 (58.8%), when they arrive at the service and have to fill in the search fields, or when they come across schedules of doctors who are not available. The data collected in this way will allow us to identify where the service needs improvement, make changes and then monitor progress.
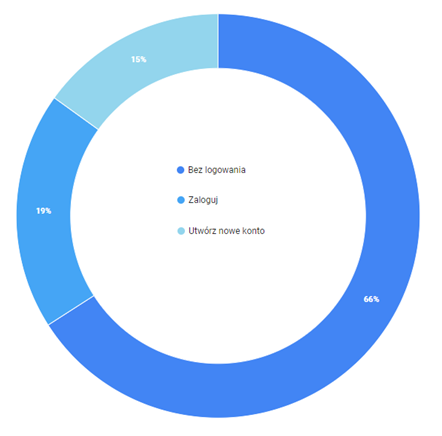
Segment or Die!
When analysing the data, it is important to go from the big picture to the detail, i.e. to see what choices users make at key moments, and an example of this is certainly the payment method. This insight is interesting as it allows you to determine whether the service is being used by regular patients, new patients or people who are one-off customers. As you can see, the vast majority, 66% of people, book appointments without logging in. On the other hand, 15% chose to create an account and take advantage of the 10% first booking promotion. In addition, 19% are people who have been using enel-med services for a long time.